Wooly Worms Conclusion
a. . The degrees of freedom used in this exercise was 6
c. Chi-square value is 40.06.
d. Our results show that this could not have happened by chance, or that it would be rather unlikely. This means that the results are statiscally significant, which can be shown by the high chi-square value that we got from the exercise
e. The Shaggy phenotype was captured the least which indicates its positive selection pressure. The Burt and Shrek phenotype were subjected to negative selection pressure, which means they were captured the most.
f. Burt and Shrek—negative— will decline over time, and Shaggy—the positive—will increase and thrive.
g. Over a long period of time, the Shaggy worms could continue to thrive as the Burt and Shrek worms would near their inevitable extinction (assuming they don't miraculously evolve).
h. Because Burt and Shrek were a light green, they stood out to predators against the dark contrast of the dirt.
i. If the environment remained the same over time, the populations with less grandiose colors—brown and tan-ish—would die off, and the ones with the more neutral and darker colors would continue to survive and thrive without the competition from their colorful competitors.
Students Parking Lot
Teacher Parking Lot
Post-Lab Questions (Species Diversity)
1. Identify the parking lot that was most diverse. Based on your observations during the lab, explain why your prediction in question 1 of the pre-lab was supported or not supported.
The student parking lot was the most diverse in terms of car brands, which supports our prediction in question 1.
2. List the single most abundant species in each set of data, and write a plausible explanation to explain why these are the most abundant species.
The most abundant species were 14 Fords in the staff parking lot and 21 chevys in the student parking lot. These were the most abundant because we live in the Central Valley where agriculture is heavily relied on, where many people live and work on farms, and where trucks would aid in that sort of industry.
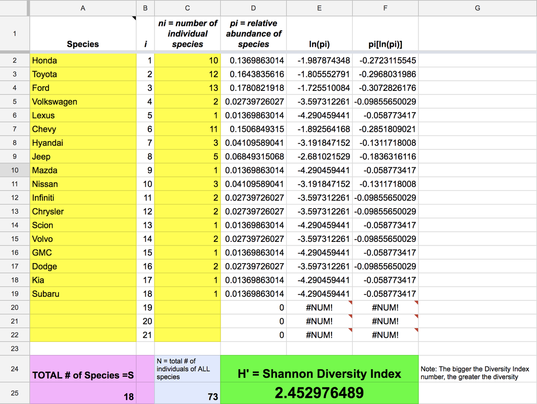
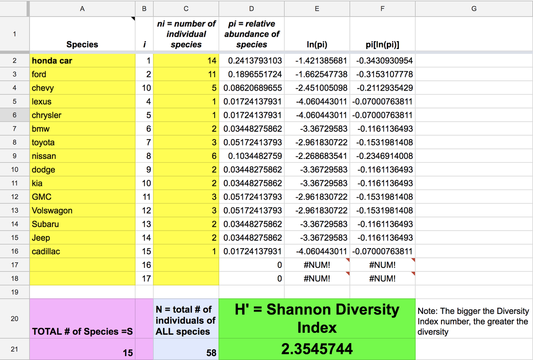
3. Determine the maximum and minimum values for the Shannon Diversity Index in the parking lot you surveyed.
The maximum value was 2.453 which was the Shannon Diversity Index in the student parking lot. The Shannon Diversity Index in the teacher parking lot was 2.355 which was the minimum value.
4. If you conducted this lab in a shopping mall parking lot, predict whether the Shannon Diversity Index would be high or low, and how would it compare to the school parking lots.
The Shannon Diversity Index in a shopping mall parking lot would be higher because a diverse group of people shop there. With a wide variety of stores, the lifestyles and socioeconomic status of individuals there would be diverse which means the type of cars they would use would also be diverse. The Shannon Diversity Index would definitely be higher than in either school parking lot.
5. If you conducted this lab at a new car dealership, predict whether the Shannon Diversity Index would be high or low, and how it would compare to the school parking lots.
-If this lab was performed at a new car dealership the Shannon Diversity Index would be lower. Unlike the student and staff parking lots, there would only be one type of car brand present at the dealership.
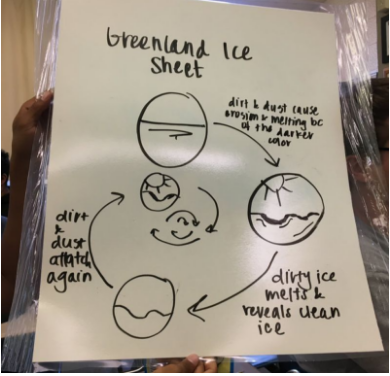
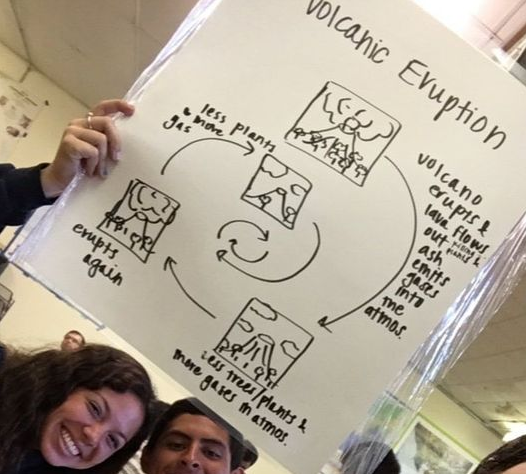
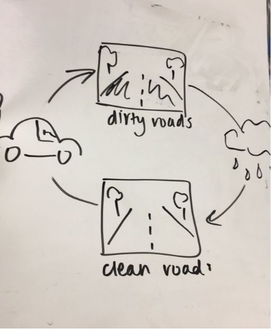
Feedback Loops
|
|
|
Climate Change (9/15/17)
CO2 Levels (1970-2017)
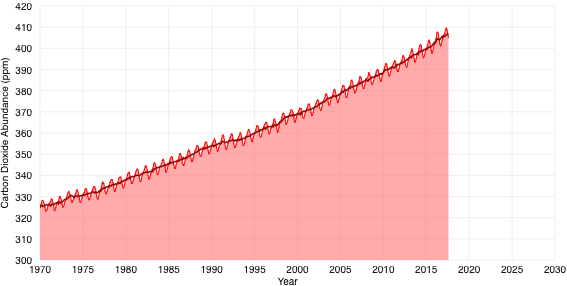
This graph displays the changes in the level of CO2 in the atmosphere from 1970 to 2017. It follows a pretty obvious trend...as technological advancements and the human population continues to grow, CO2 levels increase. Humans have accelerated climate change to an alarming rate.
Drought Monitor (August 2015)
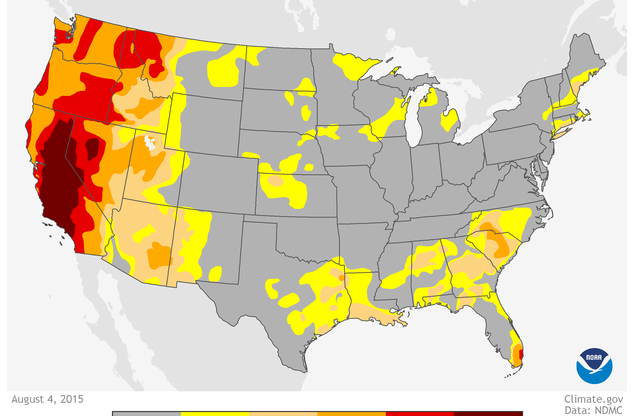
Here is the data in regards to the drought in the United States in August of 2015. As one can see, California, parts of Oregon, and parts of Washington are facing severe drought. To be fair, I knew this already, but it is nice to see it depicted using colors because it allows me to get a better grasp on the severity level.
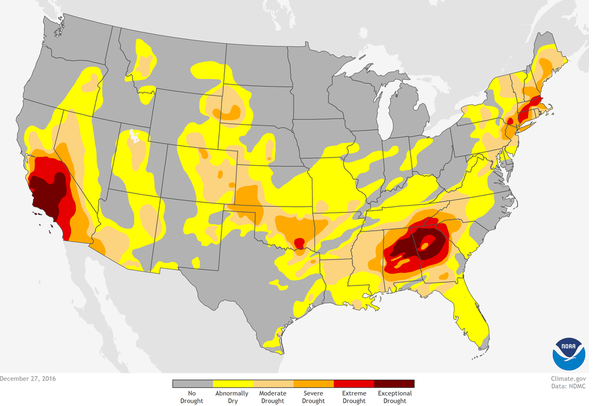
Drought Monitor (December 2016)Here is the drought monitoring data for December of 2016. As we can see, Oregon and Washington show no signs of red—or even orange for that matter. Northern California has improved, whereas Southern California continues to suffer. What is interesting is that now the South is experiencing some extreme drought problems. Which is interesting considering the South had the most condensation in the year 2015.
|
|
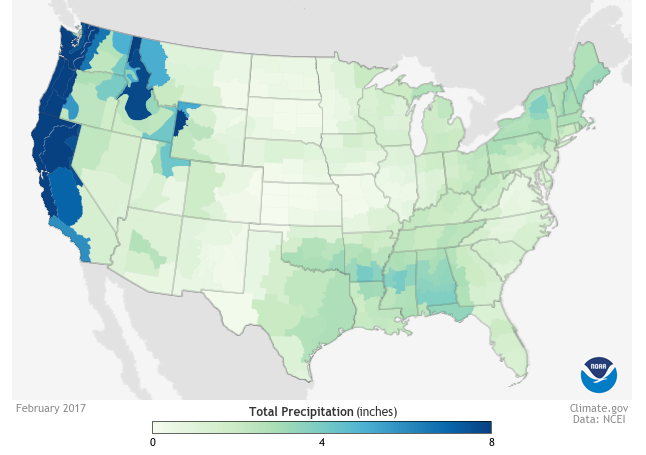
Monthly Precipitation (February)The west coast is bipolar. First, they suffer through one of the worst droughts in the United States in the past decade. And now—based on the graph—they have an abundance of water. The south, which had the most precipitation in 2015, is getting less water. I predict that this has something to do with the cold water of the Pacific and the warm water in the Gulf of Mexico.
|
|
Sea Surface Temperature
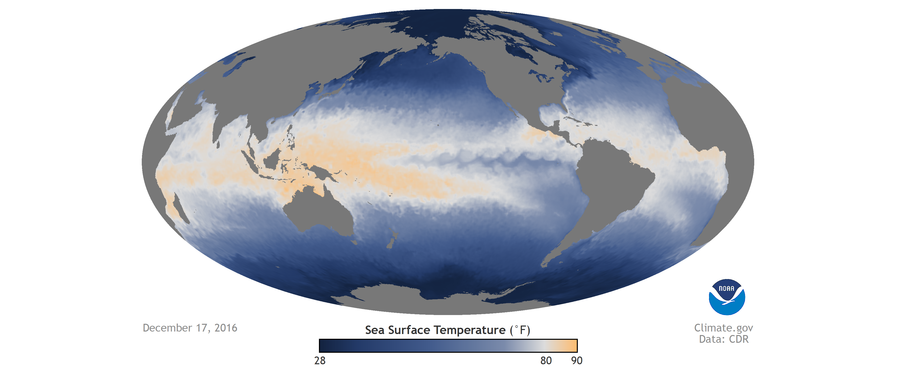
This picture is showing the surface temperatures of the different parts of the sea as of December 2016. If the orange color means that the ocean's temperature is rising, then it would not be hard to figure out why. The ocean absorbs CO2...when it is colder. As the levels of CO2 rise, the ocean heats up and cannot hold as much Co2—releasing it into the atmosphere.
Population Pyramids
|
|
This is the population chart of Turlock, California. The structure of the graph is stable and will remain stable unless some disaster or epidemic happens.
|
